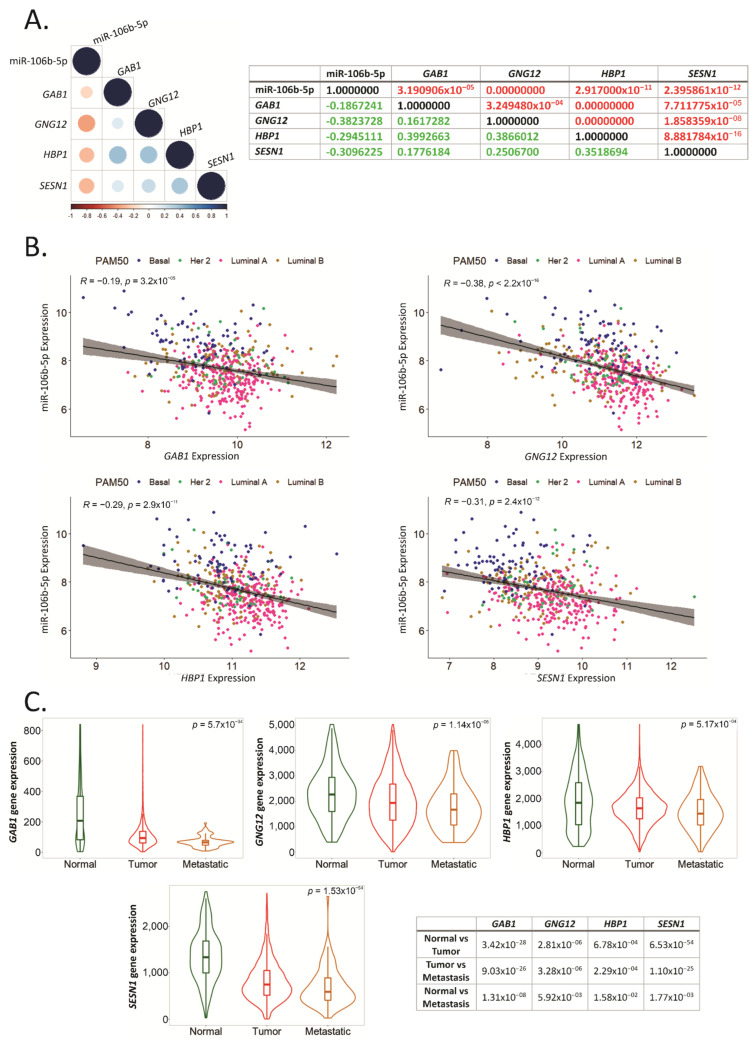
Figure 7.
Hsa-miR-106b-5p negatively correlates with GAB1, GNG12, HBP1 and SESN1. (A) Matrix correlation showing existing correlation between hsa-miR-106b-5p expression in BCa tissue from the TCGA-BRCA cohort and target genes. p-values and Spearman correlation value are indicated in the table in red and green, respectively. (B) Spearman correlation between hsa-miR-106b-5p expression in BCa tissue from the TCGA-BRCA dataset, and each target gene is plotted distinguishing between BCa subtypes. The pink, golden, green and blue circles represent Luminal A, Luminal B, Her2 and Basal BCa subtypes, respectively. (C) Expression levels of the mentioned genes in normal mammary glands (Normal), BCa tissue (Tumor) and metastatic BCa (Metastatic) are graphed using TNMplot bioinformatic tool. Statistical analysis was performed using the Kruskal–Wallis (K-W) test followed by Dunn’s. The p-value of the K-W test is indicated on the top right corner of each graph. Dunn’s comparison’s p-value corresponding to each gene and each graph are resumed in the table.

