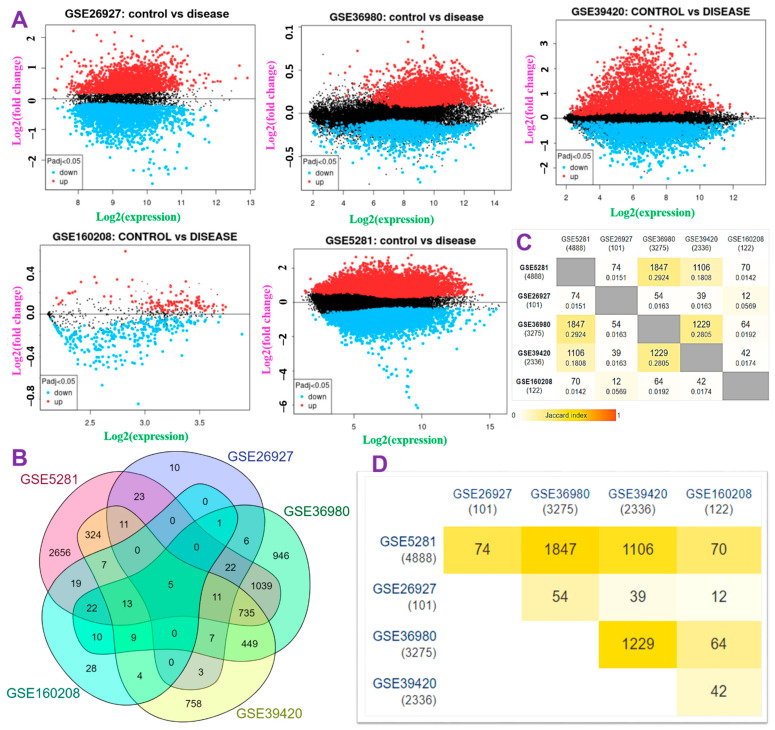
Figure 2.
Identification of differentially expressed genes (DEGs) among patients with Alzheimer’s disease (AD) and healthy controls. (A) Volcano plot showing distributions of DEGs among AD patients and healthy controls. The top DEGs satisfied the criteria of log(multiple of change (MC) value) and p < 0.05. (B) Venn diagram of the DEGs across the six datasets. (C,D) Heatmap showing the Jaccard index of the DEGs in each of the datasets.

