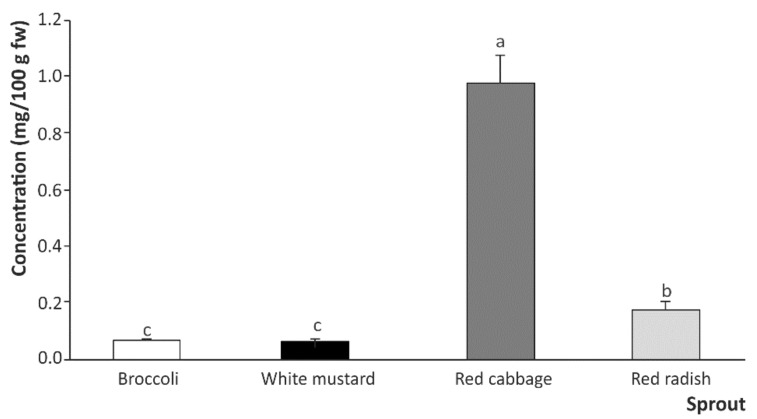
Figure 4.
Total content of ITCs and indoles in the digestates after direct intestinal digestion on plant material. Results are expressed as mean ± SD (n = 3). Bars with different lowercase letters are significantly different at p < 0.01 according to the analysis of variance (ANOVA) and Tukey’s multiple range test.

