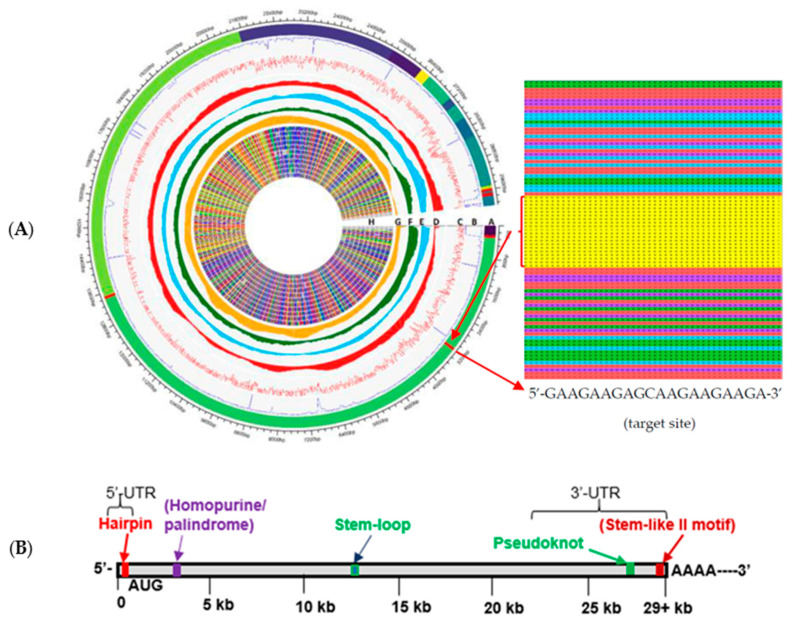
Figure 1.
(A): GWRPD map of SARS-CoV-2. Track A: multiple (ORFs) indicating different NSARS-CoV-2 ORF1ab polyproteins, 5′ UTR and 3′ UTR. Red stripes in these regions represent the five most conserved oligomer sequences. Track B: reinforcement learning approach with a comparison between the sparse-spike fragments of variant locations and highly conserved. Track C: red noise curve representing a similar approach for 311 SARS-related coronavirus isolates from 2003 to early 2019, includings mostly human hosts and several other species. Tracks D–G: Four tracks of red, blue, green, and orange histograms show the average distributions of A, C, G, and T nucleotides in all 1557 SARS-CoV-2 records. Track H: Heatmap of 12 sample sequences from 1557 sequences, mapped to the reference genome showing their conserved aligned regions and variations in some regions. Zoomed inset panel shows part of the complete alignment of 1557 with triplex target sequence and structure. (B): Mechanisms of RNA-level control predicted for SARS-CoV-2 based on RNA sequence conservation.

