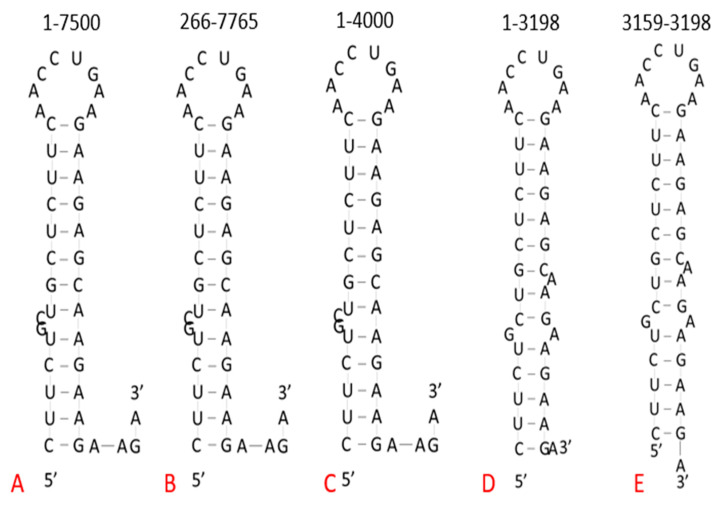
Figure 2.
Comparison of homopurine/palindrome structure using different regions of the genome in RNAfold WebServer. (A) Predicted structure when folding nucleotides 1–7500, the maximum length allowed by RNAfold. (B) Predicted structure when folding from the end of the 5′ UTR and including the maximum number of nucleotides allowed by the program. (C) Predicted structure when folding nucleotides 1–4000, a short stretch beyond the end of the palindromic region. (D) Predicted structure when folding from the beginning of the genome to the last nucleotide of the palindromic sequence. (E) Predicted structure of the isolated palindromic sequence.

