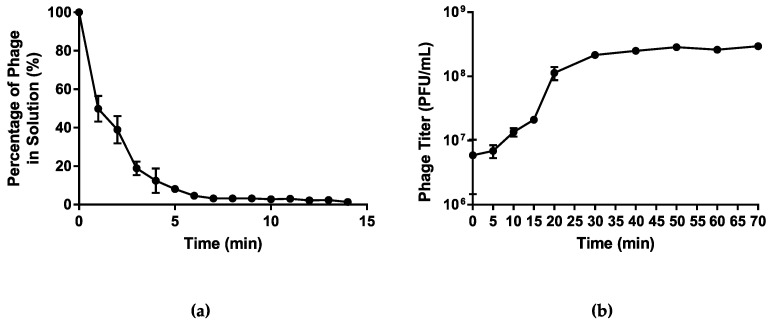
Figure 3.
Growth characteristics of vB_PmiS_PM-CJR. (a) The host adsorption assay. The percentage of the phage that did not adsorb to the host cells is shown on the y axis. (b) One-step growth curve. Phage titer at different times is shown on the y axis, time point 0 corresponds to the moment of the first plating (26 min post-infection). Mean values ± SD (standard deviation) of three independent experiments are plotted.

