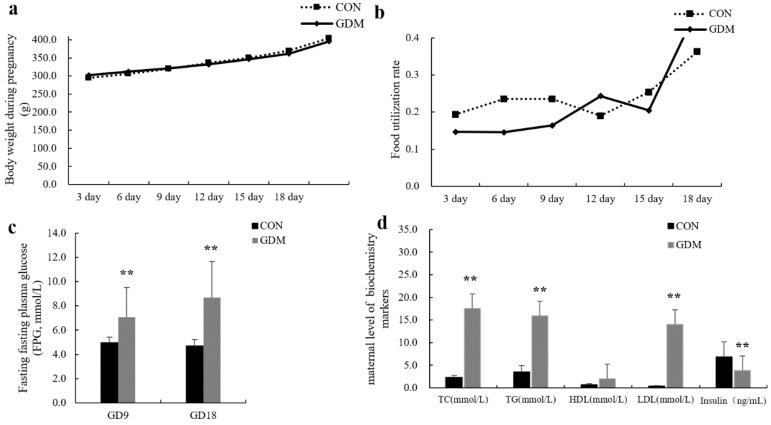
Figure 1.
The body weight, food utilization rate, FPG during the gestation, and maternal serum biochemistry markers in CON and GDM. ** p < 0.01. (a) The line chart of maternal body weight during pregnancy. (b) The line chart of maternal food utilization rate during pregnancy. (c) The bar chart of fasting plasma glucose in the second and third trimesters. (d) The bar chart of maternal level of biochemistry markers.

