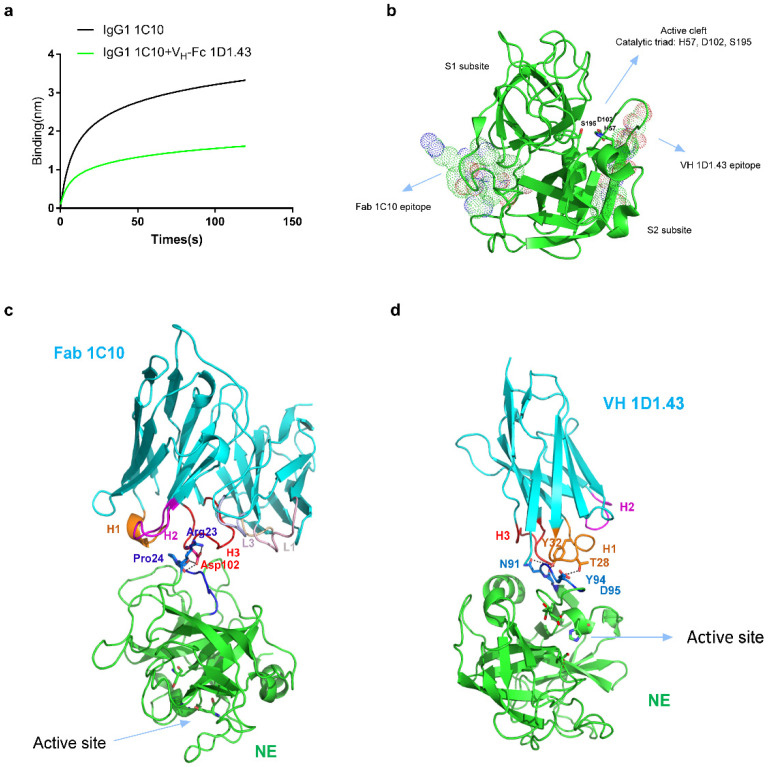
Figure 6.
Epitope mapping of VH-Fc 1D1.43 and IgG1 1C10 by using conformational epitope mappings. (a) Competition between VH-Fc 1D1.43 and IgG1 1C10 measured by BLItz. (b) The binding region of VH 1D1.43 and Fab 1C10 on hNE (PDB: 3Q76) based on the conformational epitope mapping results with the binding motifs highlighted by dot presentations. The enzymatic sites are shown by the stick models. (c,d) The detailed binding model of Fab 1C10 and VH 1D1.43 on hNE, as predicted by Z-DOCK programs. Human NE is represented as green cartoons with active site highlighted by sticks and binding epitope highlighted by blue color. Fab 1C10 and VH 1D1.43 are represented as cyan cartoons with highlighted colored CDR loops.

