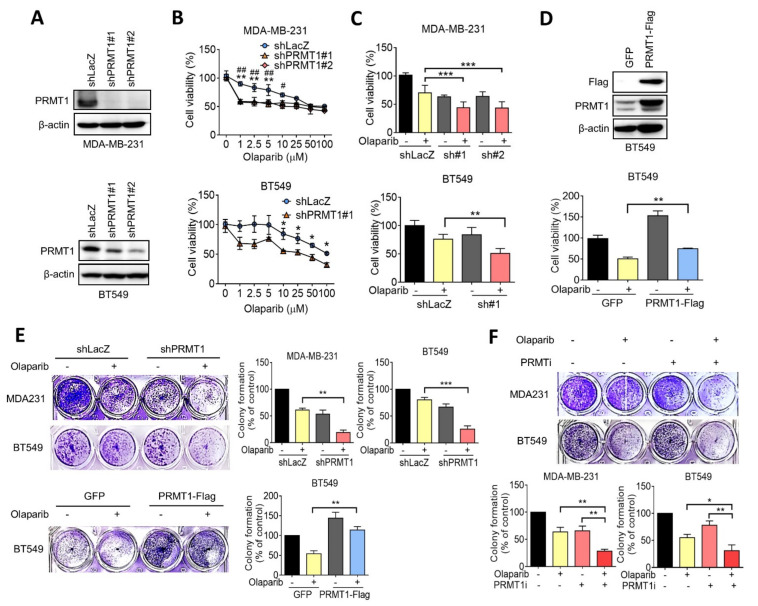
Figure 2.
PRMT1 correlates with olaparib resistance in triple-negative breast cancer (TNBC) cells. (A) Western blotting indicating knockdown efficacies of PRMT1 shRNAs confirmed by MDA-MB-231 and BT549 cells. β-actin was used as an internal control. (B) MDA-MB-231 and BT549 cells were treated with various doses of olaparib (0, 1, 2.5, 5, 10, 25, 50, and 100 μM) for 7 days. Fresh medium with olaparib was replaced every 3 days. Cell viability was measured by using 3-(4,5-dimethylthiazol-2-yl)-2,5-diphenyltetrazolium bromide solution (MTT) assay. Data are expressed as a percentage of the control. Values are expressed as the mean ± standard error. ** p < 0.01 (shLacZ compared to shPRMT1#1); ## p < 0.01 and # p < 0.05 (shLacZ compared to shPRMT1#2). (C) MDA-MB-231 and BT549 were respectively treated with 5 μM and 10 μM olaparib for 7 days. An MTT assay was used to evaluate cell viability. (D) Western blotting indicating the efficacy of PRMT1 overexpression confirmed by BT549 cells. PRMT1 vector was labeled with a Flag tag, and BT549 cells were transiently transfected with PRMT1-Flag plasmid (upper panel). BT549 cells were treated with 10 μM olaparib for 7 days as previously described, and an MTT assay was performed. (E) Representative images of colony formation for MDA-MB-231 and BT549 treated with olaparib (5 μM and 10 μM) for 10 days. Fresh medium containing olaparib was replaced every 3 days. (F) Colony formation for MDA-MB-231 and BT549 cells treated with olaparib (5 μM and 10 μM) combined with PRMT1 inhibitor C7280948 (80 μM) for 10 days. Quantification of clonogenic formation was carried out using Image J software. Data were obtained from three biological replicates. Unpaired t tests were performed to compare expression levels in two groups. * p < 0.05, **p < 0.01, *** p < 0.001 were considered statistically significant.

