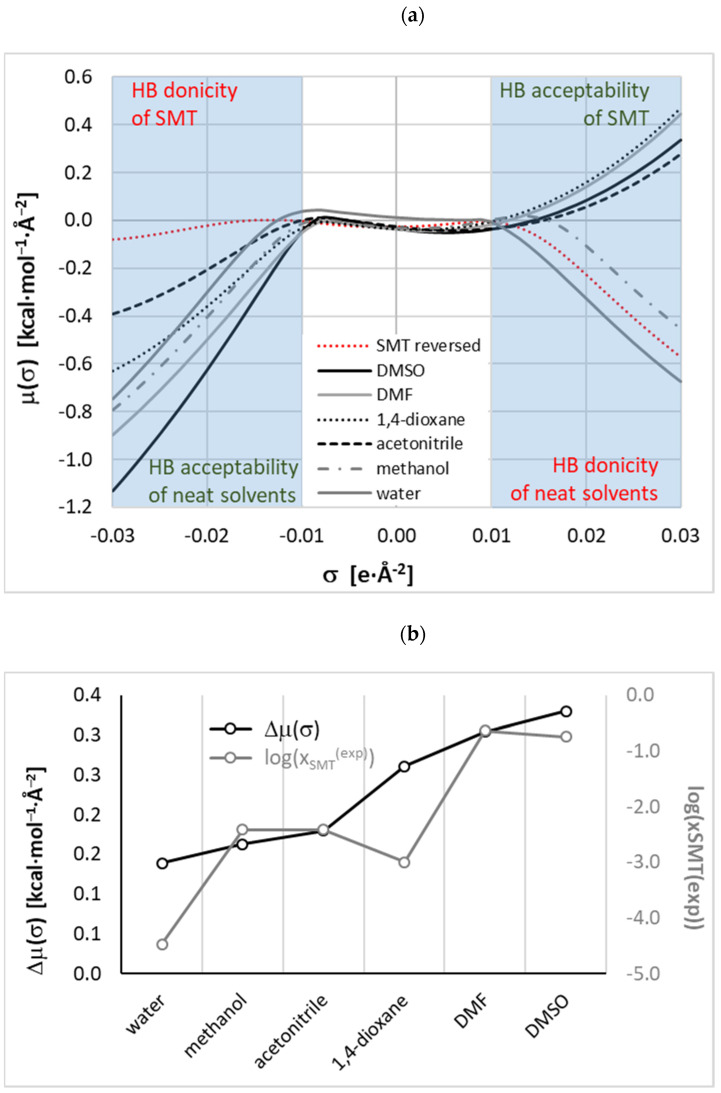
Figure 3.
(a) Distributions of σ-potentials, μ(σ), as a function of charge density, σ, for six neat solvents and SMT at room temperature. Trend of the solute was presented in the reversed form. (b) Qualitative correspondence between solubility (gray lines and right axis) and TA index for studied systems.

