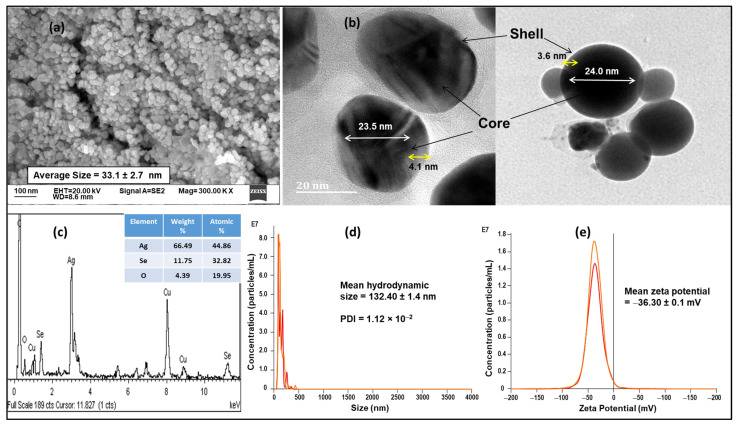
Figure 2.
(a) Scanning electron microscopy (SEM) image of Ag@Se NPs, (b) High resolution-transmission electron microscopy (HR-TEM) image of Ag@Se NP core-shell, (c) HR-TEM- energy dispersive x-ray (EDX) spectrum of Ag@Se NPs by weight and atomic percent, (d) Ag@Se NP concentration and size from nanoparticle tracking analysis (NTA) and, (e) Ag@Se NP concentration and zeta potential from NTA.

