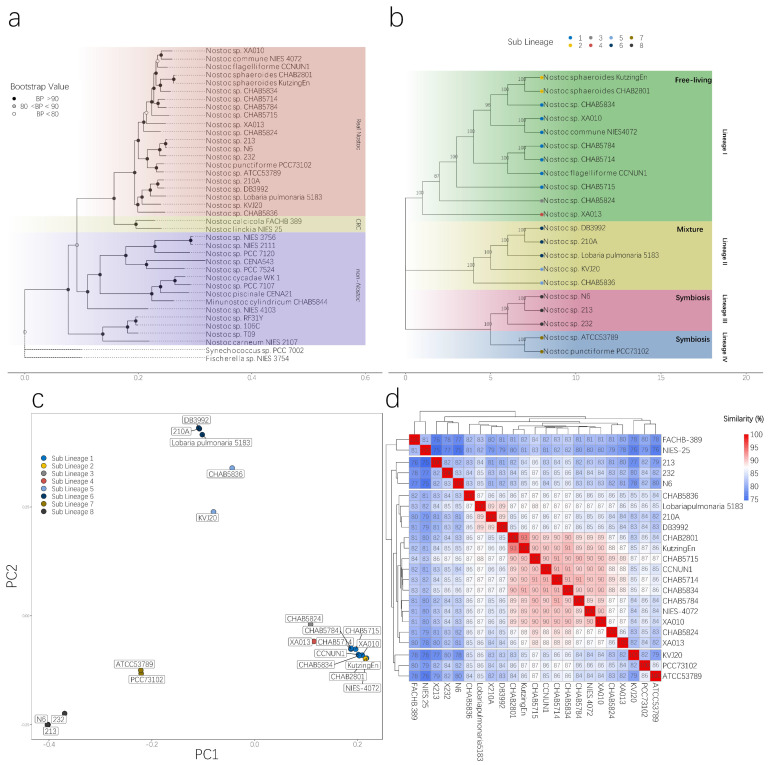
Figure 3.
Phylogenetic differentiation of RNS and non-Nostoc species. (a). Maximum likelihood phylogenetic tree reconstruction of the core genome of 37 strains of the genome of Nostoc-like strains by using the Raxml software. A GTRGAMMA model was adopted in the analysis, and 100 bootstrap tests were performed. The number on each node represents the bootstrap value. (b). Nostoc was divided into four clades and marked in different colors by Bayesian analysis of population structure. (c). Principal component analysis of the shared SNPs among RNS genera, (d). Average nucleotide identity (ANI) among Nostoc and CRC strains. The color gradient shows the ANI value of each genome pair. The final analysis results were plotted using the ggplot2 v3.1.0 software package [47].

