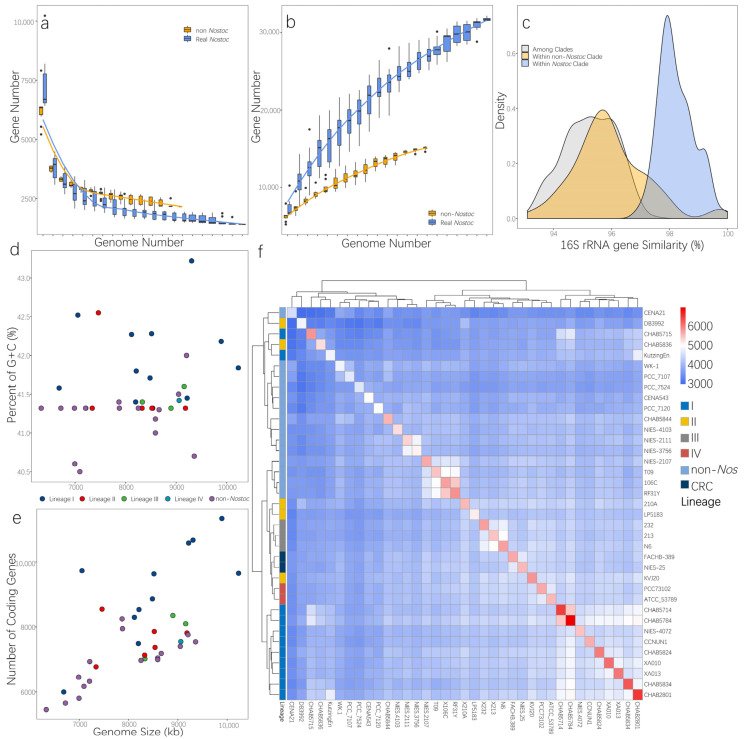
Figure 4.
Comparison of genomic characteristics of RNS and non-Nostoc species. The core pan-genomes of RNS and non-Nostoc species were estimated. (a). Core genome. (b). Pan-genome. (c). Density plot of paired-wise comparison of 16S rRNA gene similarity. Comparison of (d) G + C ratio on each strain (e) genome size versus the number of coding genes. (f). Shared number of ortholog proteins of each strain. The strains with high similarity were clustered together via the hclust method. Each color lump on the rows represents the phylogenetic clade of each strain, and the clustering results were counted and plotted using the Pheatmap package in R [49].

