Figure 3.
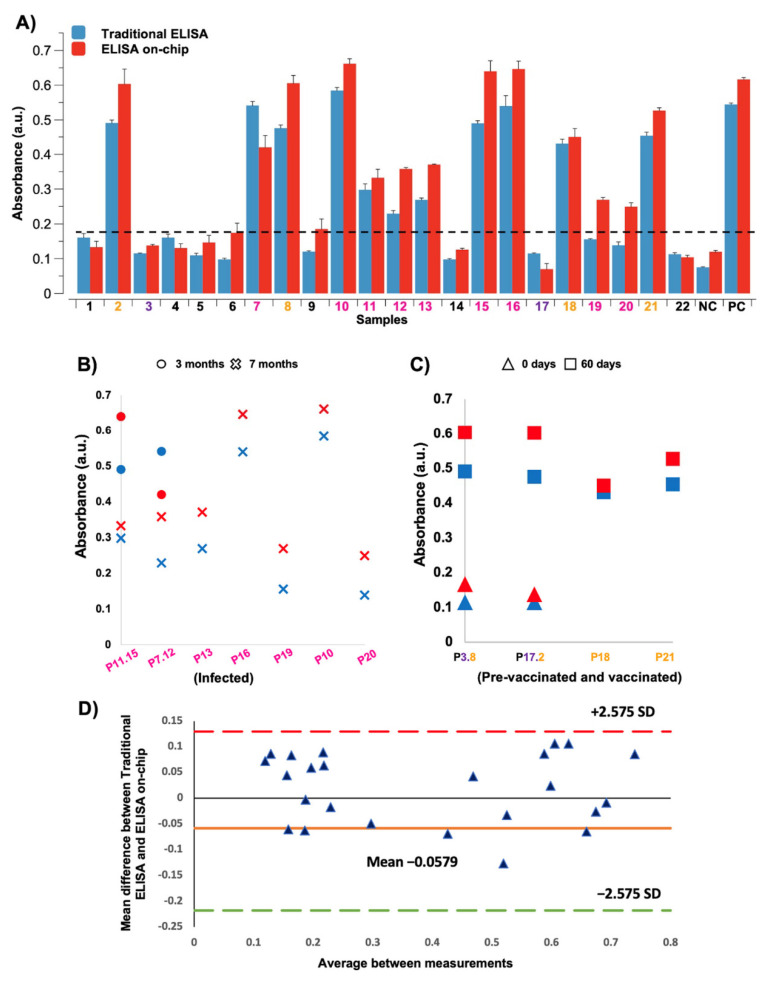
Absorbance comparison between the traditional ELISA and our automated ELISA on-chip. The resulting colorimetric reactions from both immunoassay formats were analyzed with a microplate reader. (A) Measured absorbance of the 22 serum samples, 1 negative control (NC), and 1 positive control (PC). The sample number is colored according to the following code: healthy subjects in black, pre-vaccinated subjects in purple, vaccinated subjects in orange, and infected subjects in pink. The dotted line indicates the absorbance limit measured in serum samples from healthy subjects. (B) Measured absorbance of the serum samples collected from COVID-19 patients 3 months (circle) and 7 months (cross) after infection. The sample color and patient code are in accordance with the one presented in Figure 3A. Patients with a code containing 2 numbers provided two different samples (e.g., patient P11.15 provided samples 11 and 15). (C) Measured absorbance of the serum samples collected from vaccinated individuals prior to being vaccinated (triangle) and 60 days after vaccination (square). The sample color and patient code are in accordance with the one presented in Figure 3A. Patients with a code containing two numbers provided two different samples (e.g., patient P3.8 provided samples 3 and 8). (D) Bland-Altman plot that shows the mean difference between the measurements obtained from the traditional ELISA and ELISA on-chip when the colorimetric reactions were analyzed by a microplate reader at 450 nm. For this analysis, 99% limits of agreement (±2.575 SD) were used.

