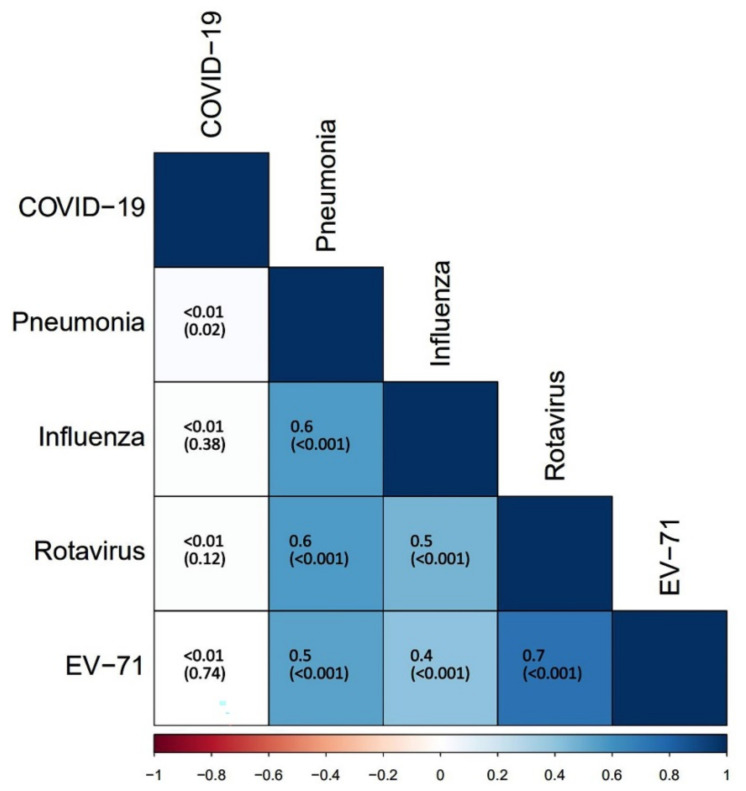
Figure 2.
Correlation among vaccination uptake of four Category II vaccines in children and parental acceptance of childhood COVID-19 vaccines. The color in the lower left quarter represented the intensity of correlation. The Cramer’s V coefficients and p values in the parentheses were presented in the squares. Cramer’s V > 0.6 indicated a strong correlation, while Cramer’s V < 0.3 indicated a weak correlation.

