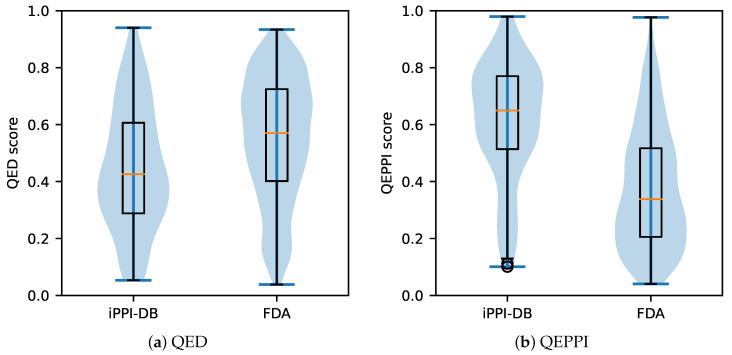
Figure 2.
Distribution of QED and QEPPI in the PPI-targeting compounds dataset and FDA-approved drug dataset. Each filled area extends to represent the entire data range, with optional lines at the median. The QED score was calculated for both datasets (a). The QEPPI score was calculated for both datasets (b).

