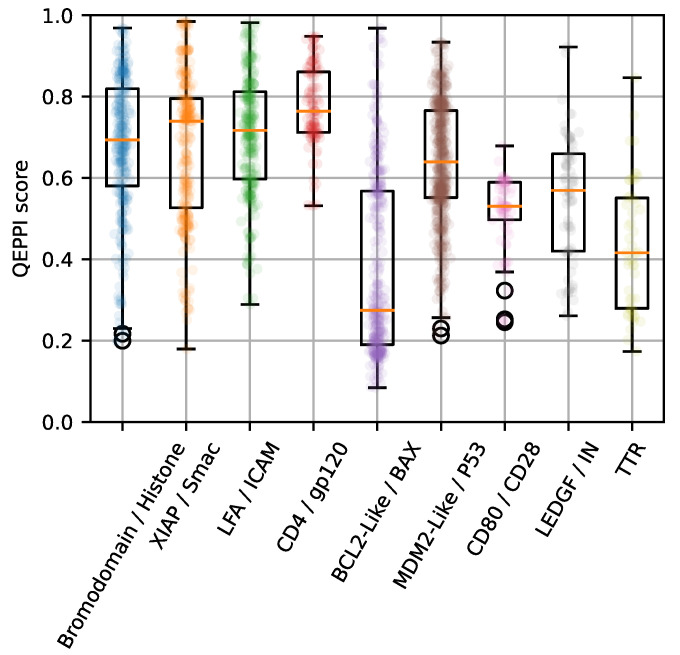
Figure 7.
Distribution of QEPPI scores for 9 PPI families with more than 50 compounds targeting each PPI family in iPPI-DB. The jitter overlaid on the boxplots shows the QEPPI scores for all samples in each dataset. Statistics related to this figure are shown in Supplementary Table S5.

