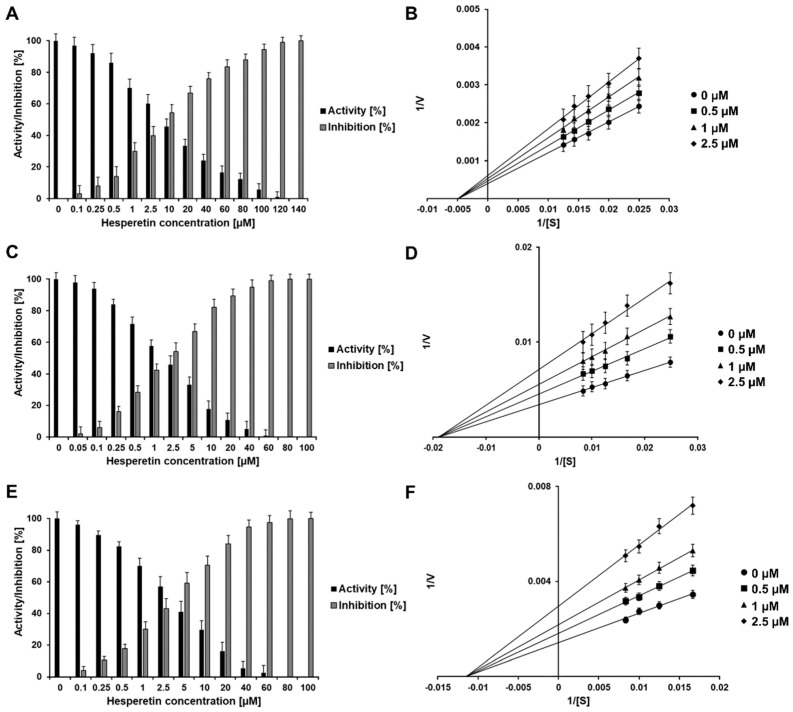
Figure 3.
Normalized activity, inhibition effect and inhibition mode of HST over DENV2, YFV, and WNV NS2B/NS3pro. Lineweaver-Burk plots were used to determine the inhibition modes. [S] is the substrate concentration; v is the initial reaction rate. Inhibition of DENV2, YFV, and WNV NS2B/NS3pro by HST are shown in (A,C,E), respectively. Lineweaver-Burk plots for HST inhibition of DENV2, YFV, and WNV NS2B/NS3pro are shown in (B,D,F), respectively. Data shown are the mean ± SD from 3 independent measurements (n = 3).

