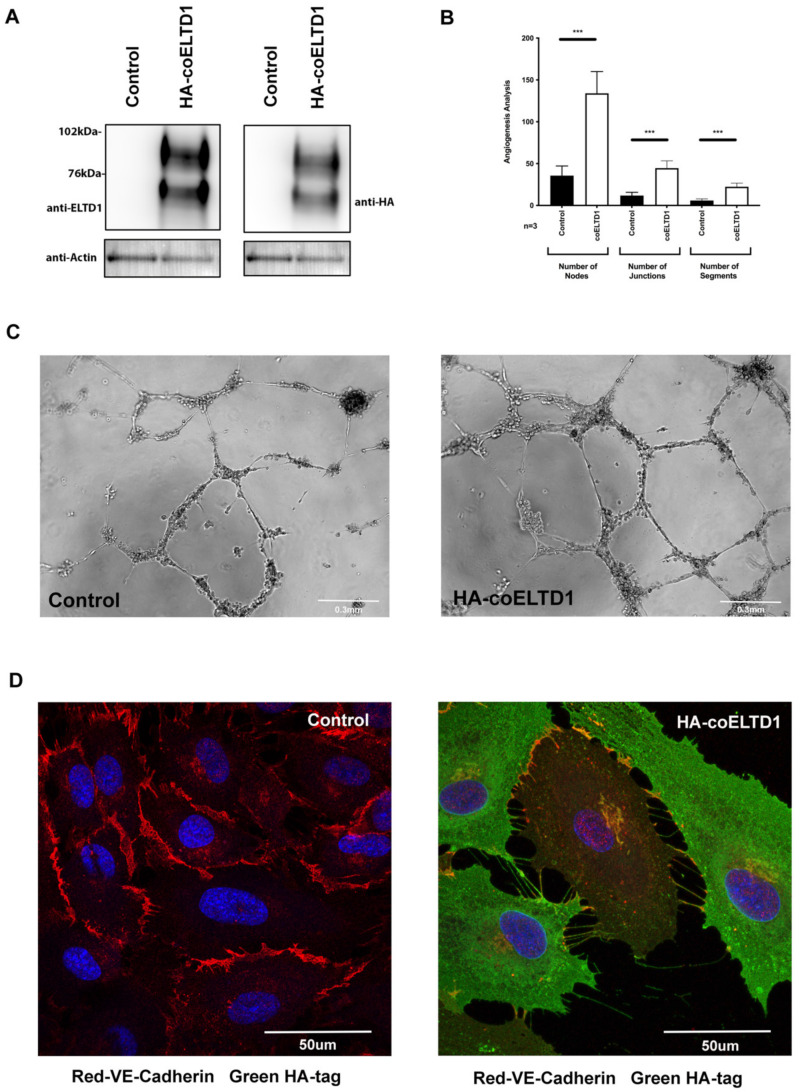
Figure 3.
HA and FLAG tagging of coELTD1. (A) Western blot of HUVEC cells transduced with control versus HA-tagged coELTD1 expressing lentivirus probed with anti-ELTD1 and anti-HA tag antibodies. (B,C) Matrigel assay of control versus HA-tagged coELTD1 expressing HUVEC with quantification of network formation. (D) Fluorescent staining of VE-Cadherin and HA-tagged coELTD1 in control and HA-coELTD1 expressing HUVEC cells at 120 h. Images were taken on a Zeiss LSM 880 Confocal Microscope (Zeiss) at 63× magnification. *** p < 0.0005.

