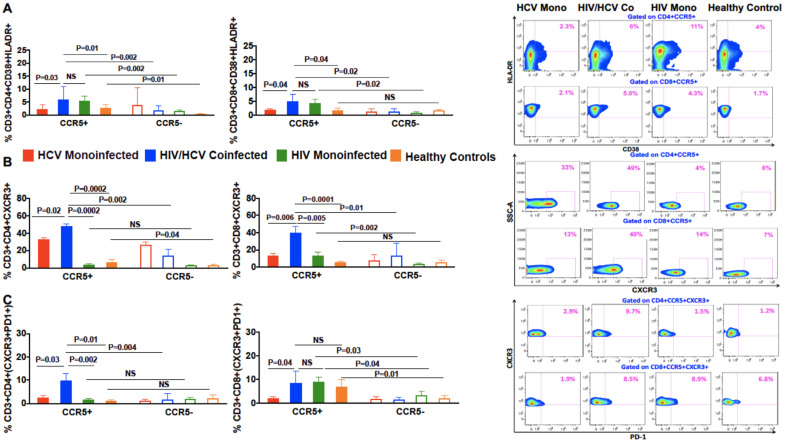
Figure 2.
Differences in the frequencies of CD38/HLADR, CXCR3 and PD1+CXCR3+ on CCR5+ and CCR5 negative CD4+ and CD8+ T cells in patients with HIV/HCV coinfection and HCV monoinfection. Flow cytometry plots of a patient and bar graphs with HCV monoinfection, HIV/HCV coinfection, HIV monoinfection and healthy controls demonstrating the differences in the percentages of (A) CD38+HLADR+ on CD4+CCR5+ and CD8+CCR5+ T cells (B) CXCR3 on CD4+CCR5+ and CD8+CCR5+ T cells (C) CXCR3+PD1+ on CD4+CCR5+ and CD8+CCR5+ T cells. Data are expressed as (mean ± SEM) and differences in the percentage of T cells expressing different markers between the two groups were analyzed using a non-parametric Mann–Whitney test in Graph Pad Prism version 6. The Wilcoxon matched-pair signed rank test was used for analyzing the differences between the CCR5+ and CCR5 negative T cells within the same group. p values less than 0.05 were considered significant.

