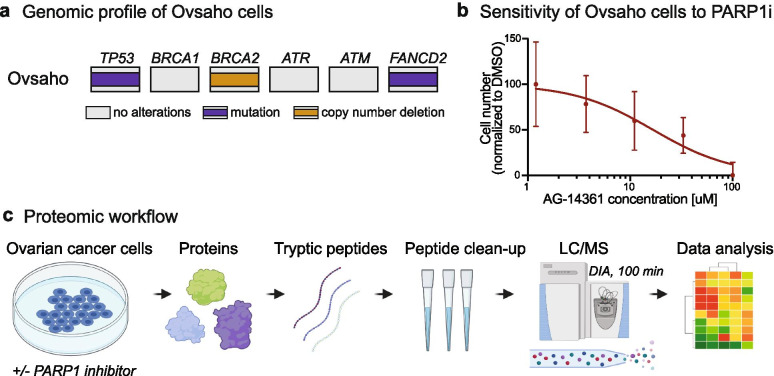
Fig. 1.
Measuring the sensitivity to PARP1 inhibition in Ovsaho cells and drug response profiling using LC/MS-MS-based proteomics. (a) Genomic profile of Ovsaho cells with HR-associated genes. Ovsaho cells have a mutation in the TP53 and FANCD2 gene and a copy number deletion of BRCA2 gene. (b) Dose-response curve based on cell number count after 72 h. PARP1 inhibitor AG-14361 treated Ovsaho cells versus control treatment. DMSO was used as control vehicle. Data represent three independent experiments and error bars represent standard derivation of technical replicates with a total number of experiments = 9. (c) Schematic view of the LC/MS-MS workflow. PARP1i-treated Ovsaho ovarian cancer cells were prepared for LC/MS-MS. Following protein extraction and tryptic digest, proteins were separated and measured in single runs using a quadrupole Orbitrap mass spectrometer. Label-free protein quantification was performed using the Spectronaut software environment. (LC-MS) Liquid Chromatography with tandem mass spectrometry. Figure 1C was created with BioRender.com

