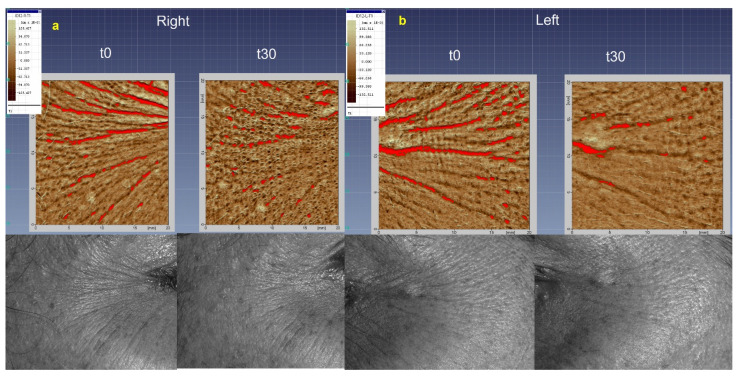
Figure 11.
3D DermaTop images (bottom part) and corresponding skin topography (upper part) at t0 and t30 days. (a) corresponds to the right side of the face where the formulation A was applied, and (b) corresponds to the left side of the face where the formulation B was applied. The reddish-colored regions indicate the depth of analyzed wrinkles.

