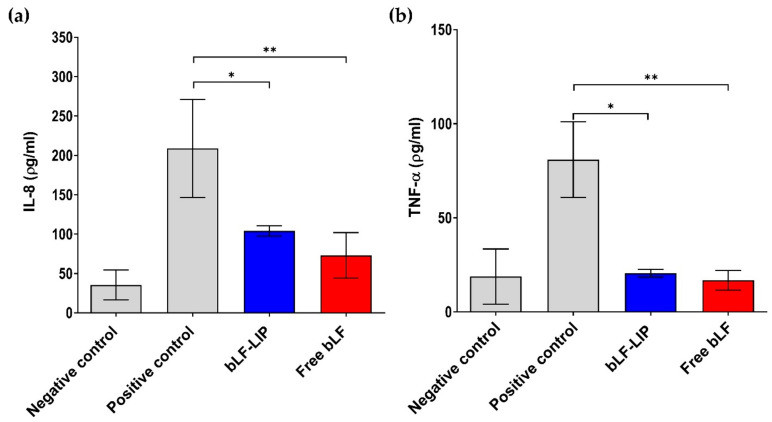
Figure 8.
(a) Quantification of secreted IL-8 proinflammatory cytokine in LPS-stimulated HCE-2 cells; (b) quantification of secreted TNF-α. Negative control: no treatment; Positive control: LPS. Values are expressed as the mean ± SD; * p < 0.05; ** p < 0.01 significantly lower than LPS-induced cytokine concentration.

