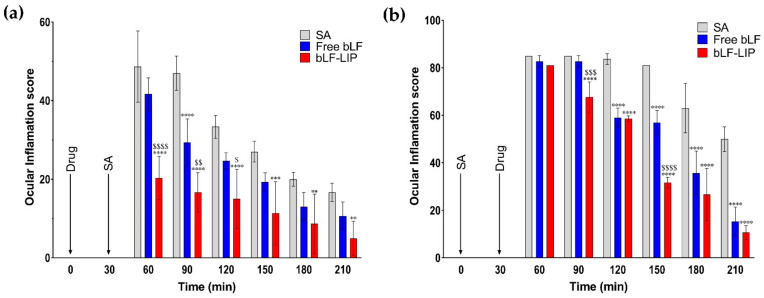
Figure 9.
(a) Ocular inflammation prevention. (b) Ocular inflammation treatment test. Values are expressed as mean ± SD; * p < 0.05, ** p < 0.01 and *** p < 0.001 and **** p < 0.0001 significantly lower than the inflammatory effect induced by SA; $ p < 0.05, $$ p < 0.01 and $$$ p < 0.001 and $$$$ p <0.0001 significantly lower than the inflammatory effect induced by free bLF.

