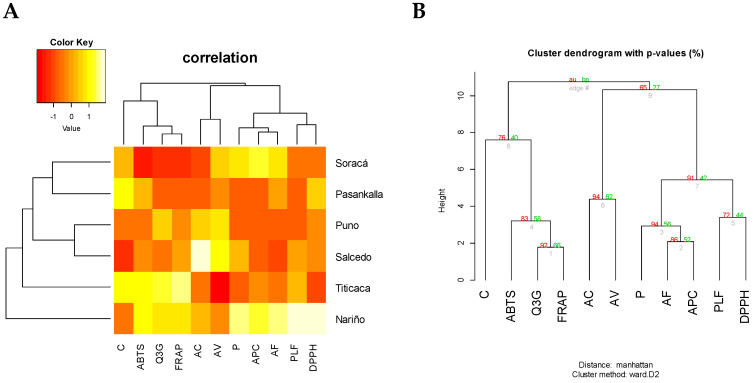
Figure 2.
Sample groups according to bioactive compositions from different quinoa seeds. (A) Heatmap analysis according to Manhattan distance. (B) Boostrap grouping. AU: ap-proximately unbiased. BP: bootstrap probability. C: caffeine, Q3G: quercetin-3-glucoside. AC: caffeic acid; AV: vanillic acid. P: pinocembrin; AF: ferulic acid. APC: p-coumaric acid and, PLF: total polyphenols.

