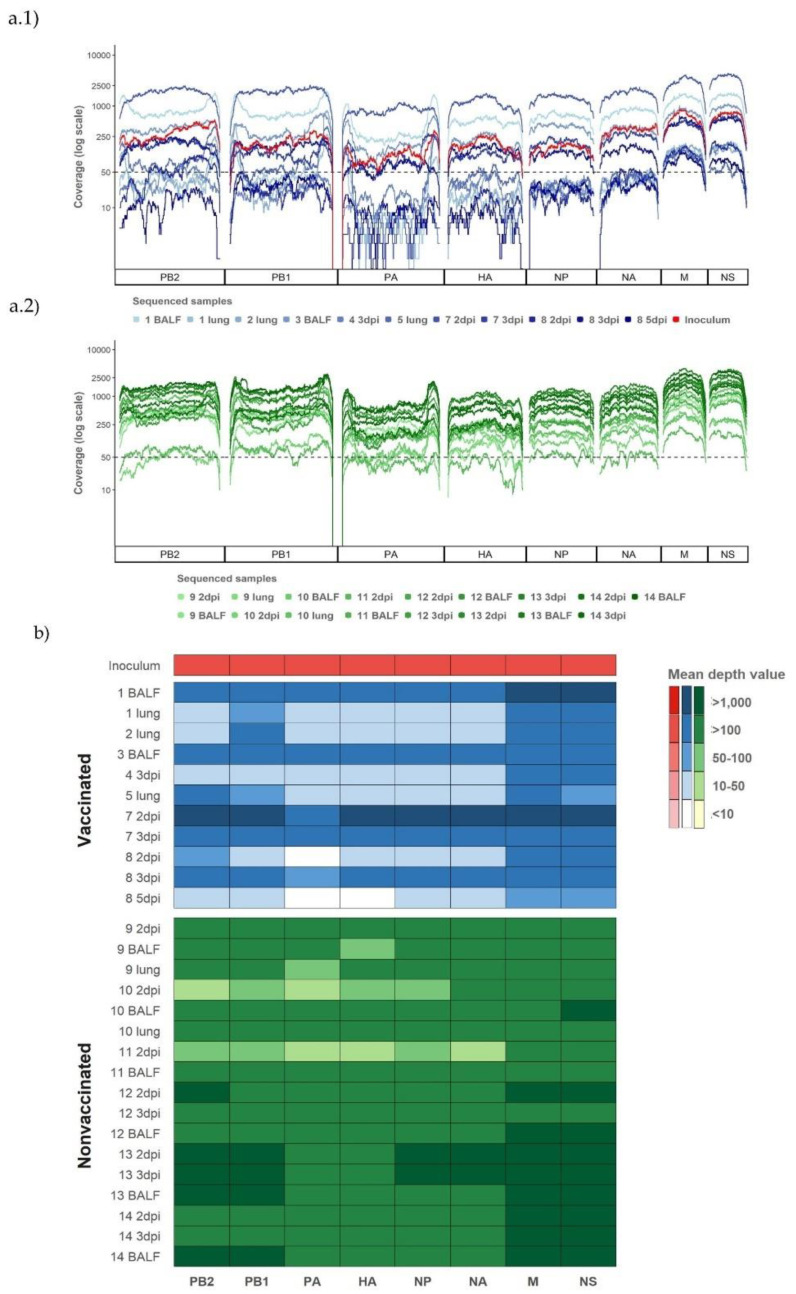
Figure 2.
Coverage per genomic segment and sample from both experimental groups and the challenge inoculum. (a) Representation of the coverage of Illumina sequencing reads mapped against A/Swine/Spain/01/2010(H1N1) used for challenge. (a1) Sequencing profiles of sequenced samples from vaccinated animals and inoculum plotted in different tones of blue and red, respectively. (a2) Sequencing profile of sequenced samples from nonvaccinated animals plotted in different tones of green. (b) Representation of the mean read coverage heat map per segment. The identification of the animal from which the samples come and the kind of collected sample are specified on the figures, with the nasal swab collected at the indicated day being the samples with dpi.

