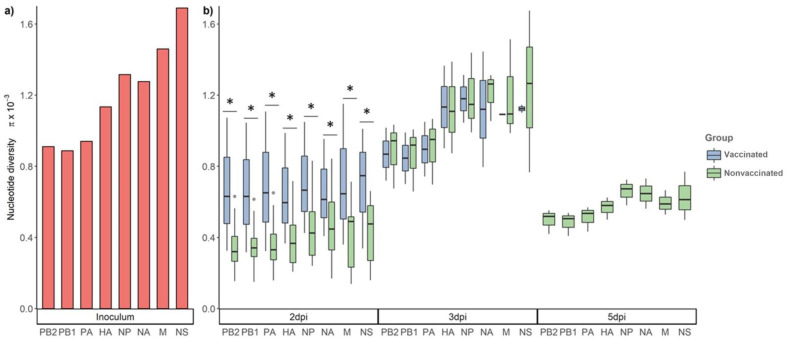
Figure 5.
Nucleotide diversity (π) in the viral population at different time points. (a) Nucleotide diversity bars of inoculum sequence. (b) Box plot of viral population nucleotide diversity from all collected samples at 2, 3, and 5 dpi from vaccinated and nonvaccinated groups. Whiskers represent variability outside the lower and upper quartiles of each represented box. * p < 0.05.

