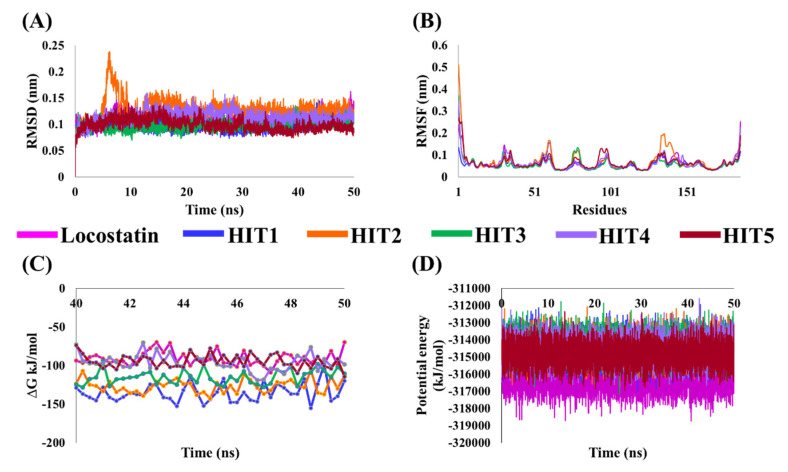
Figure 4.
Molecular dynamics (MD) simulation analyses plots demonstrating the (A) backbone root mean square deviation (RMSD), (B) backbone root mean square fluctuation (RMSF), (C) binding free energy (∆Gbind) values and (D) potential energy of the reference (REF) compound, locostatin and identified hits with RKIP.

