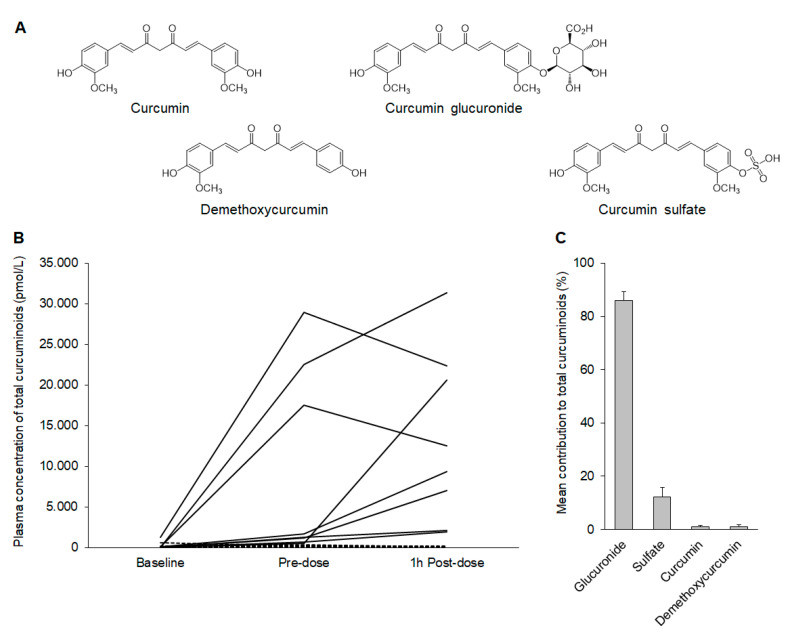
Figure 2.
Analysis of plasma curcuminoids in samples collected at baseline and on two occasions on the final day of the study, immediately prior to the last dose and 1 h post-dose. Only a subset of patients were selected at random for LC-MS/MS analysis. (A) Structures of curcumin, demethoxycurcumin, and the mono-conjugated sulfate and glucuronide metabolites analyzed in the samples. (B) Plasma concentrations of the total curcuminoids in each patient at the three time points. Solid lines correspond to the patients in the active arm (n = 8), and the dashed lines indicate the patients in the placebo arm (n = 7). (C) The profile of curcumin species detected in the patients in the active arm 1 h post-dose. Values shown are the mean (±SEM) contribution of each curcumin species detected to the total quantifiable curcuminoids for the 8 patients. The profile was similar in samples collected immediately prior to the last dose (not shown).

