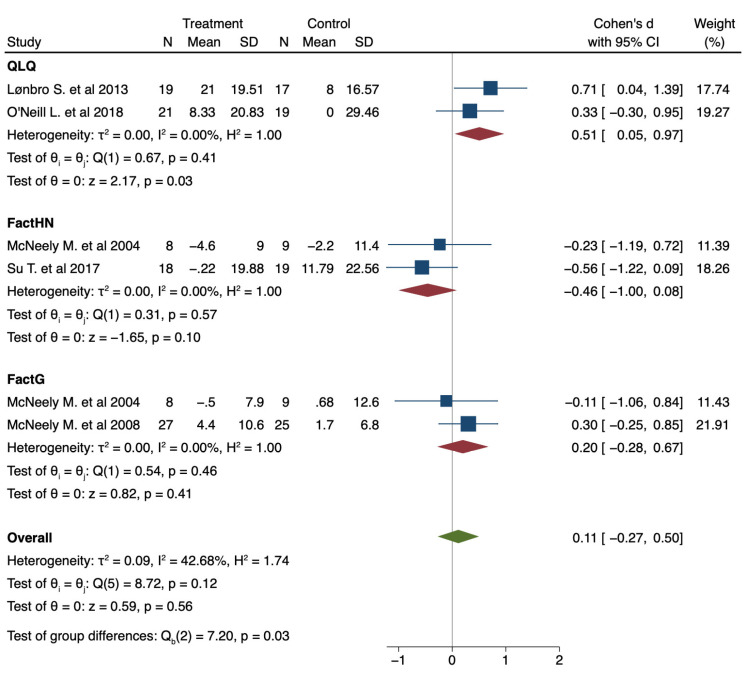
Figure 4.
Forest plot presenting the effect of exercise on the improvement of Quality of Life (QoL) measured with different instruments in patients with Head and Neck cancer (HNC) compared with control; pre–post intervention data. Values on x-axis denote Cohen’s d. The diamond illustrates the 95% confidence interval of the pooled effects.

