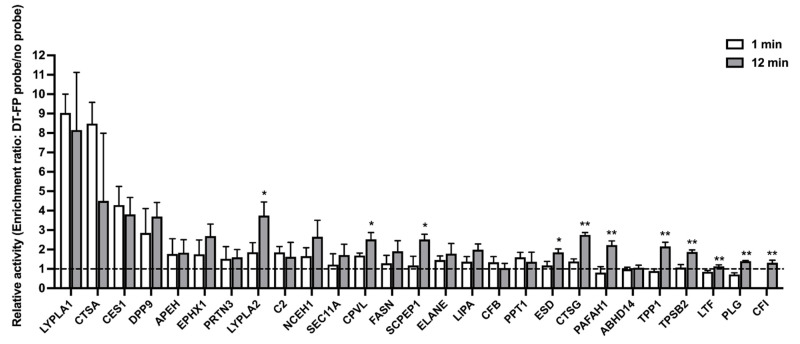
Figure 3.
The relative catalytic activity of serine hydrolases in HlungS9. The relative activity was profiled by the enrichment ratio after 1-min and 12-min incubations with the desthiobiotin-FP probe. The enrich ratio of a given hydrolase was calculated by dividing its abundance in the probe treated samples by its abundance in the control samples (without a probe, 1% DMSO). Bars show mean values (±S.D.) of three independent experiments (n = 3), except for LYPLA2 in the 1-min enrichment profile (n = 2). Values below the dashed line (enrichment ratio = 1) indicate no enrichment. * p < 0.05 and ** p < 0.01 indicate statistically significant difference compared with the 1-min incubations (Student’s t-test).

