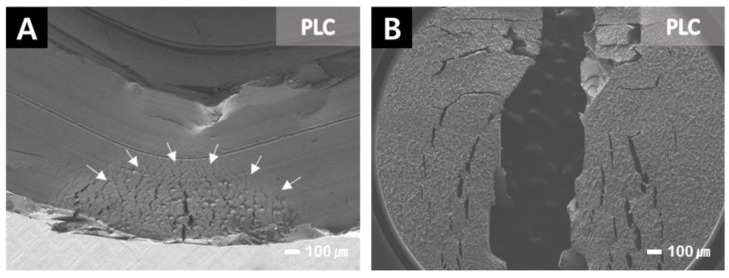
Figure 10.
SEM images of the PLC specimen after its flexural strength test at 30-times magnification. The PLC specimens were high elasticity did not break easily. Many fatigue crack lines were observed on the fracture surface. The arrows in panel indicate the fatigue crack lines. (A) Unbroken PLC specimen after fracture test, and (B) top side of a broken specimen after the flexural strength test.

