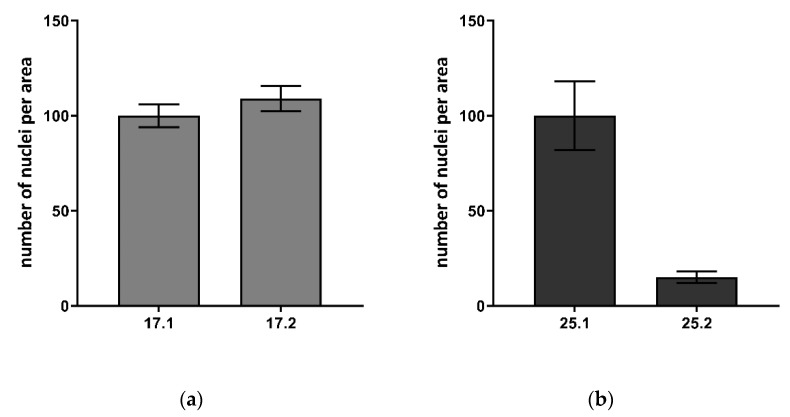
Figure 9.
The number of nuclei per area visualized on the surface of biocomposites: (a) 17.1 and 17.2; (b) 25.1 and 25.2 after 5 days of incubation. The mean ± SD number of cell nuclei visible on at least 3 fields was counted. The 17.1 material constitutes the reference for 17.1, whereas 25.1 a reference for 25.2. The control material was set as 100%.

