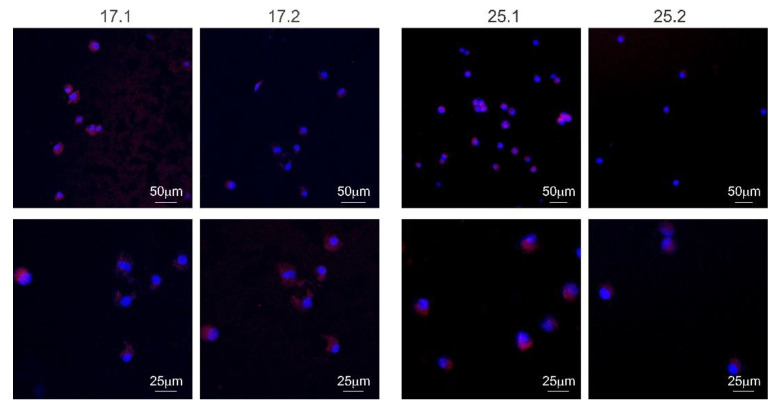
Figure 10.
Visualization of L929 cells adhesion and expansion on the surface of biocomposites (17.1, 17.2, 25.1 and 25.2) after 5 days. The nuclei were stained with 300 nM 2-(4-amidinophenyl)-1H-indole-6-carboxamidine (DAPI) and actin filaments with phalloidin conjugated with iFluor 594. Samples were imaged with the following wavelength values of excitation and emission: 405 and 430–480 nm for DAPI, 590 and 615–630 nm for iFluor 594 conjugated antibody. Leica Application Suite X (LAS X; Leica Microsystems) was used for cell imaging.

