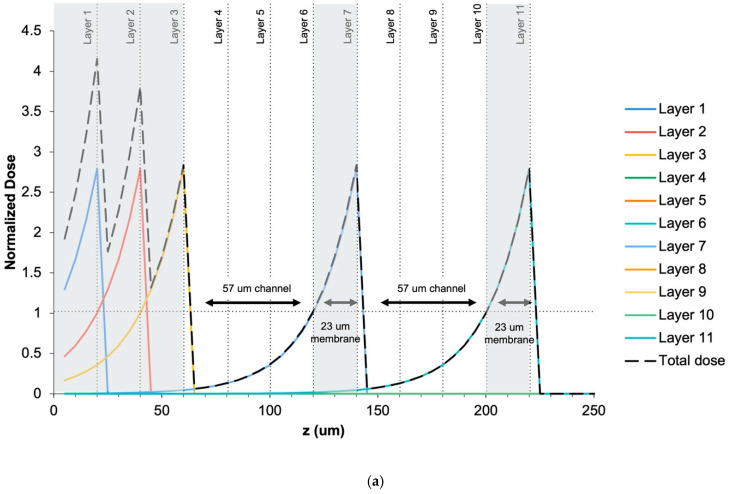
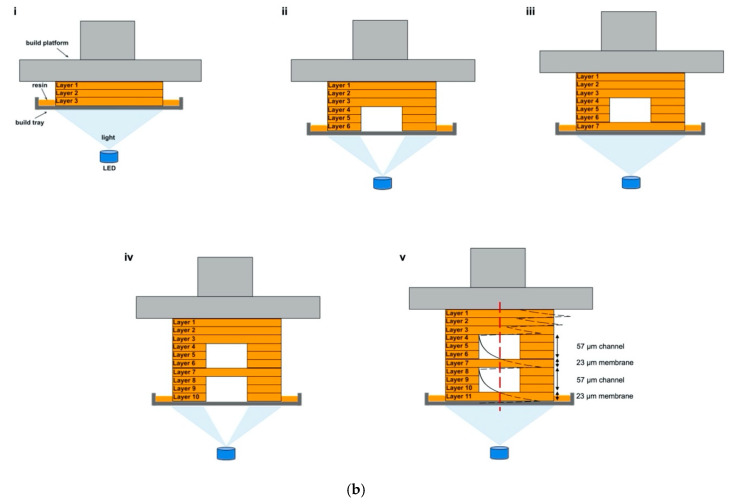
Figure 3.
(a) Dose curve simulating 57 µm channels (designed with 60 µm) with 23 µm membranes (designed with 20 µm). Exposed layers are shaded grey; (b) schematic demonstrating corresponding curing pattern to the dose curve simulation where (i) corresponds to the first 3 layers of the pattern from (a), (ii) is the next three layers forming the first channel, (iii) layer 7 is the 23 µm membrane closing off the first channel, (iv) is the next three layers forming the second channel, (v) layer 11 closes off the second channel with a 23 µm membrane. The total normalized dose curve from (a) is overlaid on (v) after rotating 90 degrees. The vertical dashed line (red) indicates the region over which the dose curve was calculated. The Schematic is not to scale.


