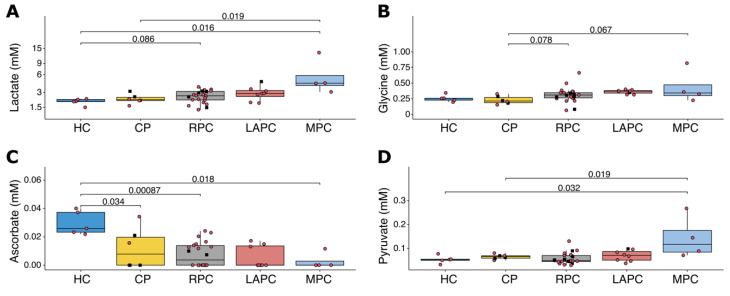
Figure 2.
Boxplots showing the comparison of the concentration of (A) Lactate, (B) Glycine, (C) Ascorbate and (D) Pyruvate for HC, CP, RPC, LAPC, and MPC. Lactate is shown to be significantly elevated across the groups, glycine was significantly elevated in MPC when compared with CP. Ascorbate was significantly downregulated in CP, RPC, LAPC, and MPC when compared to HC, while pyruvate was significantly upregulated in MPC when compared to HC, CP, HC, RPC, and LAPC. Black squares represent patients with Type 2 Diabetes Mellitus. Red circles represent patients with no Type 2 Diabetes Mellitus. HC: Healthy controls; CP: Chronic Pancreatitis; RPC: Resectable Pancreatic Adenocarcinoma; LAPC: Locally Advanced Pancreatic Adenocarcinoma; MPC: Metastatic Pancreatic Adenocarcinoma.

