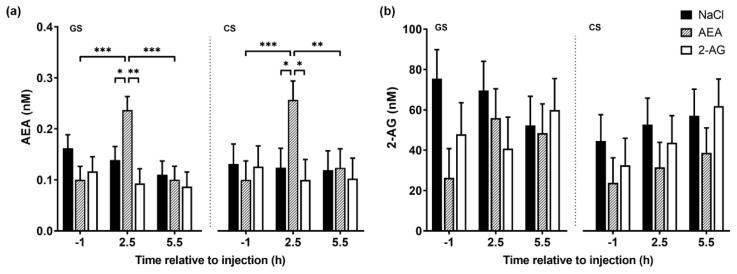
Figure 2.
Plasma endocannabinoid concentrations on day 8, 1 h before, 2.5 h and 5.5 h after intraperitoneal administration with NaCl (n = 7), AEA (n = 7) or 2-AG (n = 6). Cows were fed ad libitum a grass silage (GS) and corn silage (CS)-based diet. Data for (a) AEA (nM) and (b) 2-AG (nM) are shown as LSM ± SE. Treatment and time differences are indicated by * p < 0.05, ** p < 0.01 and *** p < 0.001 (Tukey–Kramer). ANOVA results are presented in Table S3.

