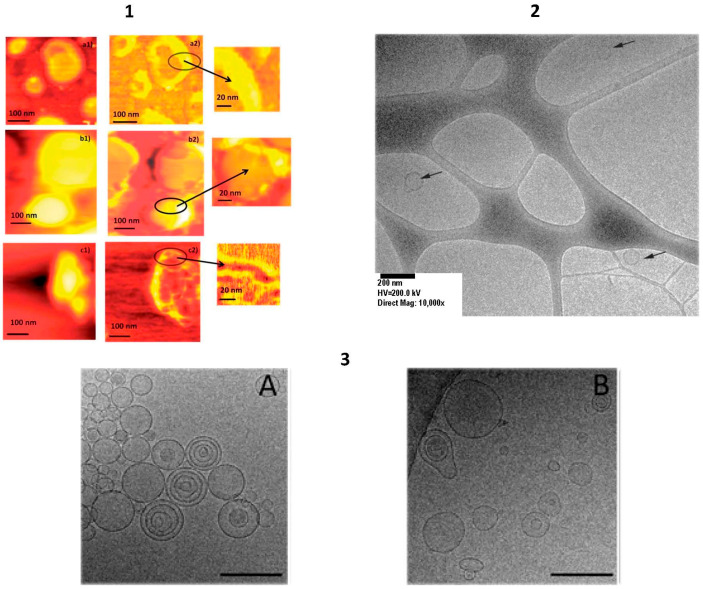
Figure 3.
AFM/TEM images of liposomes, niosomes and lipoplexes. 1. AFM images of different liposomes. ‘‘Height images’’ (1) and ‘‘phase images’’ (2) of cationic liposomes (a), classic pegylated liposomes (b) and immunoliposomes (c). Magnification of phase images; arrows indicate the detailed on liposomal surface. Image adapted with permission [137]. Copyright Taylor & Francis 2015. 2. Representative cryo-TEM images of Span20 niosomes coated with pH (low) insertion peptide. Scale bar = 200 nm [101]. Permitted reproduction under the terms and conditions of the Creative Commons Attribution (CC BY) license (https://creativecommons.org/licenses/by/4.0/, accessed on 15 May 2021) 3. Cryo-TEM images of (A) HA-liposomes, (B) HA-lipoplexes. Scale bar = 200 nm. Reproduced with permission from [120]. Copyright American Chemical Society, 2015.

