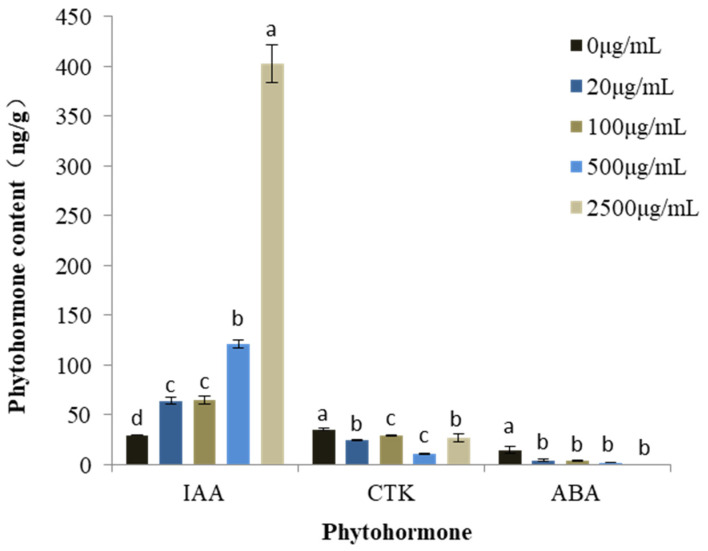
Figure 3.
Changes in phytohormone content in M. sativa seedlings treated with mixed alkaloids at different concentrations. Each value is the mean of three replicates ± SE (n = 30). Means with different letters (a, b, c, etc.) indicate significant differences at p < 0.05 level according to Fisher’s LSD test.

