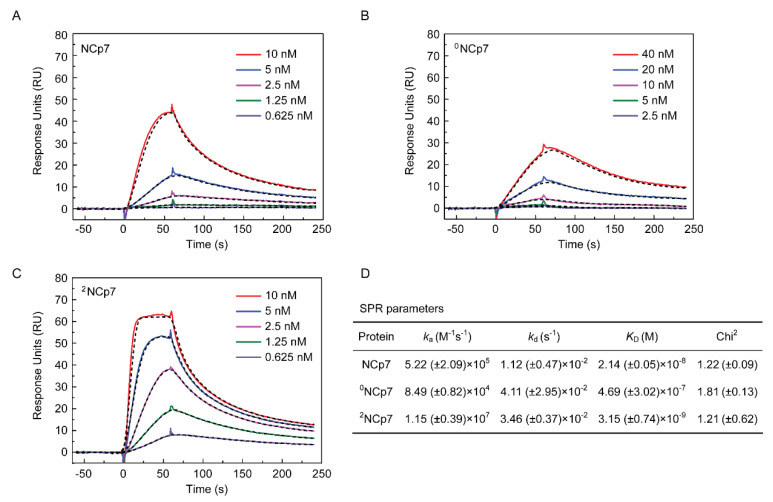
Figure 3.
Kinetic analyses of 0NCp7, NCp7 and 2NCp7 binding to SL3-RNA, determined by SPR. Representative SPR kinetic curves and fits for (A) NCp7, (B) 0NCp7 and (C) 2NCp7 binding to SL3-RNA. The amount of SL3-RNA immobilized on the chip surface was 50 RU (A, C) and 100 RU (B), respectively. The concentrations of NCp7 and 2NCp7 are 0.625, 1.25, 2.5, 5 and 10 nM, whereas the concentrations of 0NCp7 are 2.5, 5, 10, 20 and 40 nM. Experimental and fitted curves are colored and black, respectively. (D) SPR parameters of 0NCp7, NCp7 and 2NCp7 binding to SL3-RNA, generated from two independent experiments, with standard deviations in brackets. Chi-square values are also shown, which describe the deviation between the experimental and fitted curves.

