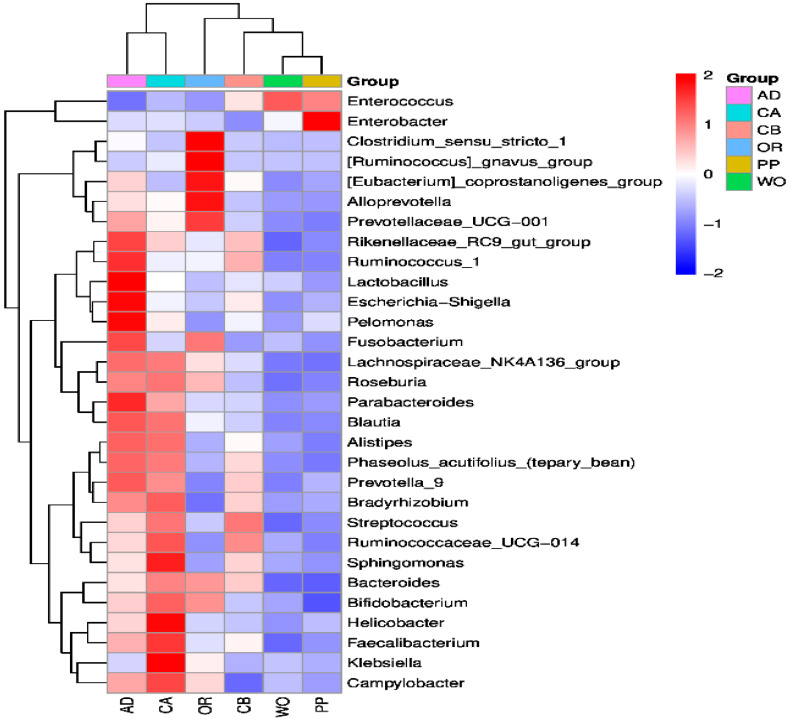
Figure 3.
Heatmap of the top 30 genera in terms of relative abundance at the genus level of each host. Columns represent different host samples, while rows represent bacterial ASV at the generic level. A cluster tree of sample microorganisms and cluster analysis of each genus are shown at the top and left, respectively. The color scale represents the normalized values of relative abundances by log10.

