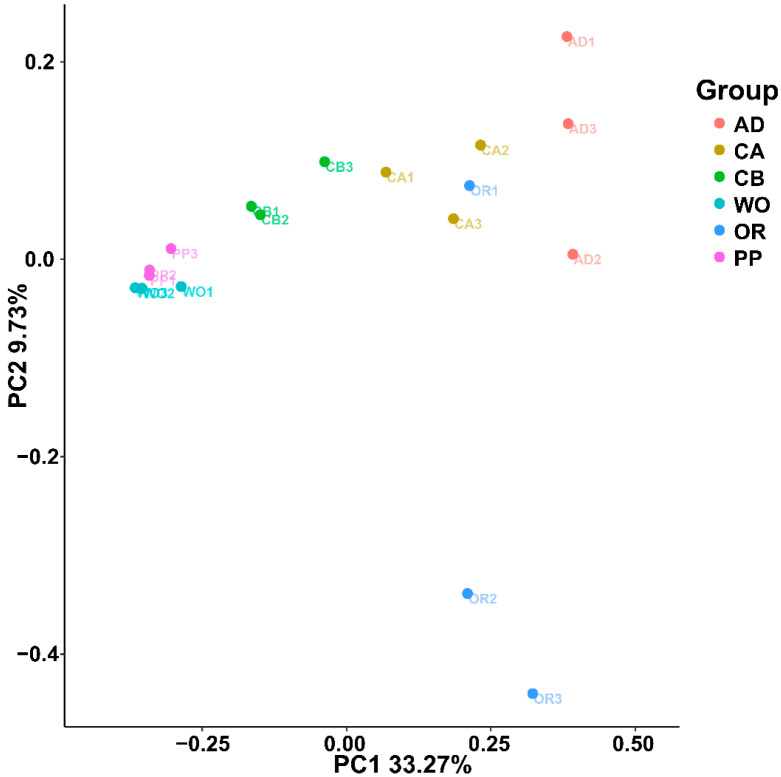
Figure 4.
Two-dimensional PCoA analysis visualization using the Bray–Curtis distance calculation method to measure different host samples. The abscissa (PC1) and ordinate (PC2) are the two main coordinates with the largest interpretative degree of differences between samples. The same color represents the same grouping. A point is a sample, and similar samples are gathered together.

