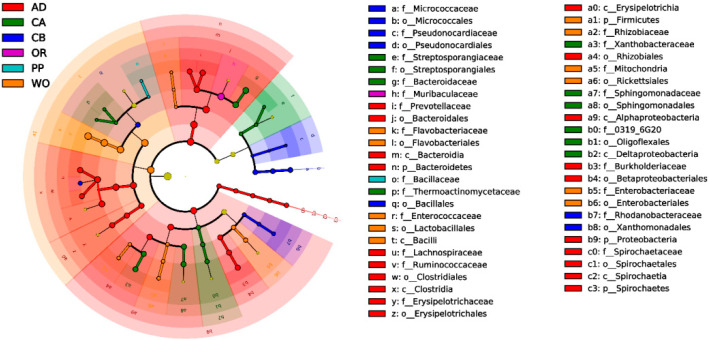
Figure 6.
Cladogram of bacterial biomarkers, from the phylum (innermost ring) to genus (outermost ring) levels. The circles at different taxonomic levels represent a taxon at that level, and the relative abundance of the flora is represented by the diameter. Insignificantly different species are yellow, and different colors represent different species. The colors represent the groups, and the different colored nodes represent the bacteria that play an important role in that group.

