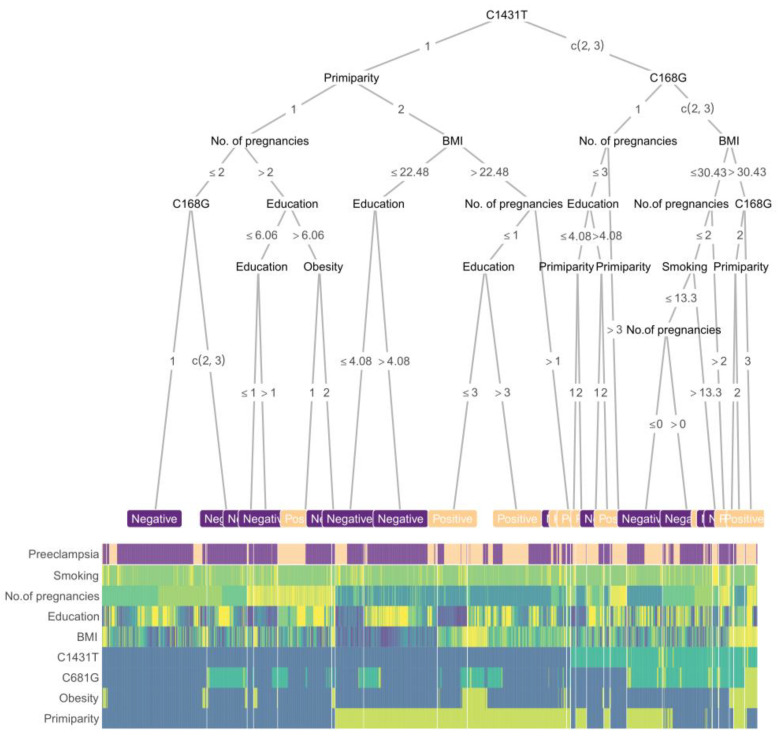
Figure 5.
Boost tree and heatmap for predicting preeclampsia. The nodes of the boost tree represent the contributing features, while branches depict the threshold values. The first row of the heatmap presents the outcomes, while the lower rows present the predictor values. The colors represent the scaled value of a sample of each feature. Primiparity and maternal C681G function as the second nodes, followed by the number of pregnancies and BMI, while education played a less important role in the final decision. For genotypes, “1” represents no mutation in the allele, “2” means a single mutation, and “3” a double mutation; for primiparity and obesity, “1” means “no” while “2” means “yes”. The corresponding threshold values are shown on the branches. Integrated values of the clinical features of individuals are presented in the heatmap, corresponding to both positive and negative end outcomes. Age: maternal age at delivery; Height: maternal height; Education: maternal education; BMI: body mass index before pregnancy; Smoking: cigarette use.

