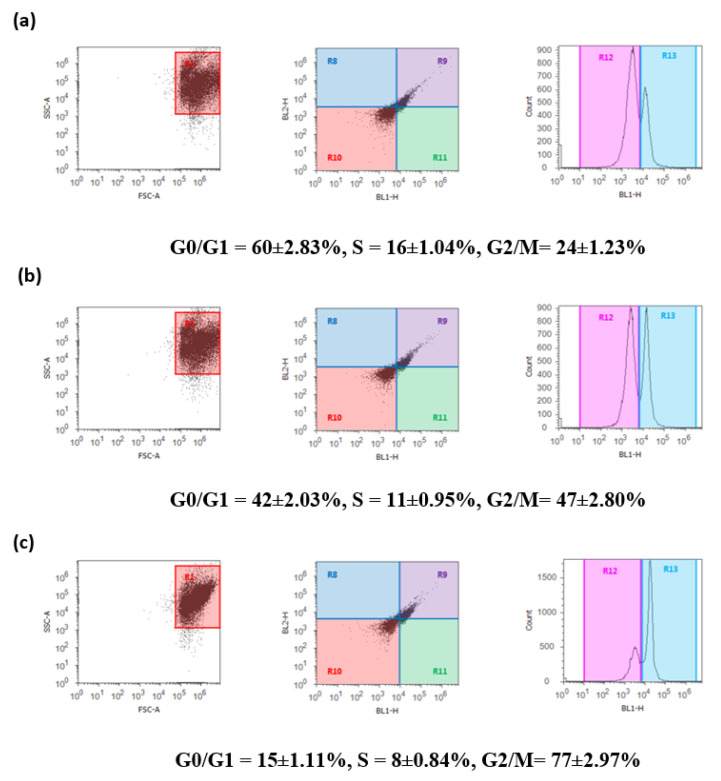
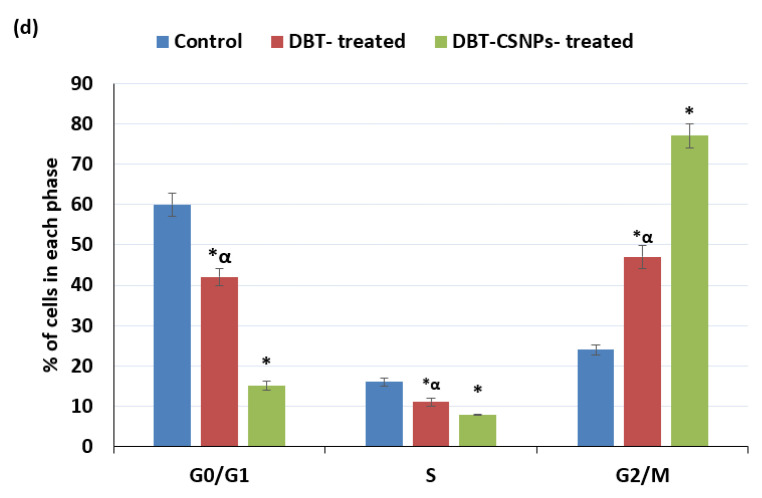
Figure 6.
Flow cytometric analysis of control and treated HepG2 cells. (a) Control, (b) DBT-treated HepG2 cells, and (c) DBT–CSNP-treated HepG2 cells. The values represent the mean ± SD (n = 3). (d) Represents % of cells in each phase. One-way ANOVA followed by Tukey’s test was used (* p< 0.05 versus saline control & α p < 0.05 versus DBT–CSNPs).


