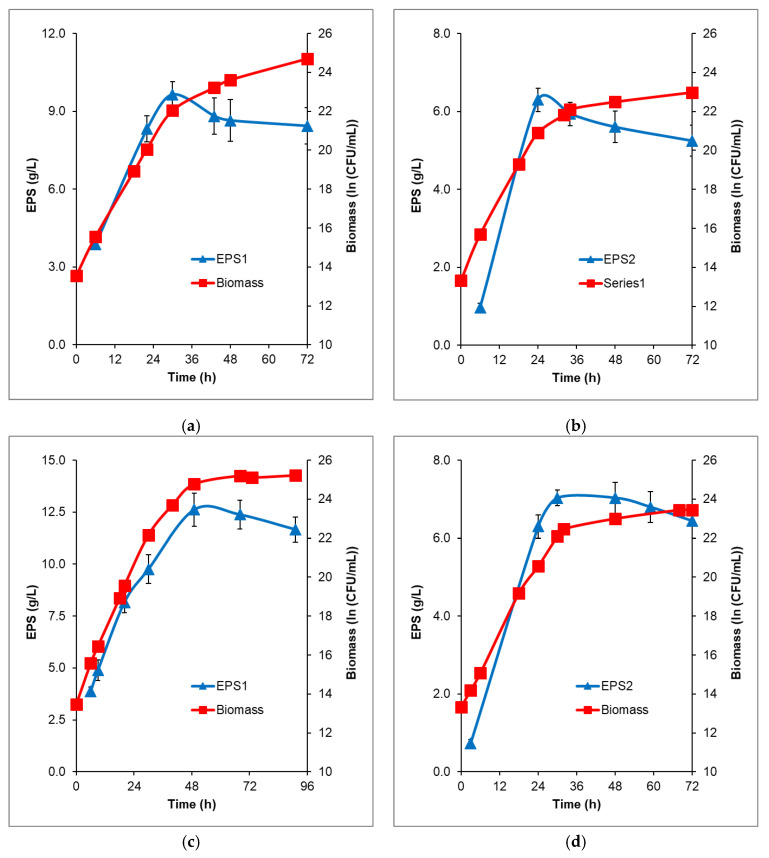
Figure 4.
Time profiles of biomass formation and EPS production by B. licheniformis 24 during batch and fed-batch fermentation in fermenter Biostat® Aplus, working volume 1 L. (a) EPS1 production during batch fermentation of glucose; (b) EPS2 production during batch fermentation of fructose; (c) EPS1 production during fed-batch fermentation of glucose; (d) EPS2 production during fed-batch fermentation of fructose. The starting sugar concentrations were 200 g/L; sterile glucose or fructose was added during the fed-processes—125 mL glucose (700 g/L) and 210 mL fructose (870 g/L). The mean values from two independent batch and fed-batch processes are presented.

