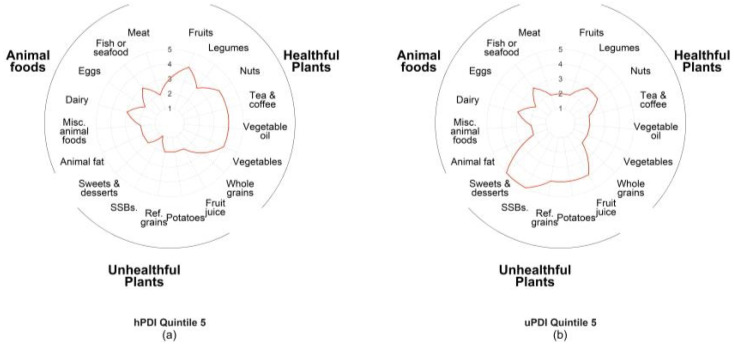
Figure 1.
Food groups contributing to plant-based diet indices among breast cancer survivors in the Pathways Study: (a) radar plot showing the food consumption patterns of the highest quintile and greatest concordance with hPDI (healthful plant-based diet index). The line represents the median score for each food group within the quintile. A higher score indicates greater consumption of the food group; (b) radar plot showing the food consumption patterns of the highest quintile of uPDI (unhealthful plant-based diet index). The line represents the median score for each food group within the quintile. A higher score indicates greater consumption of the food group.

