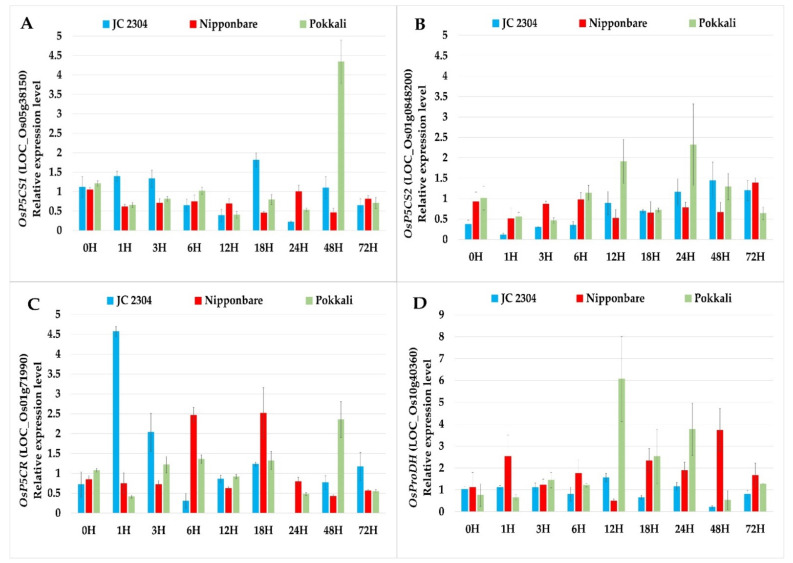
Figure 2.
Effects of salinity stress (150 mM NaCL) on relative expression of proline metabolism genes in wild and cultivated rice. The relative expression was quantified as fold change in leaf tissue of cultivated rice (O. sativa) and wild rice (O. australiensis) by quantitative Real-Time PCR (qRT-PCR). (A) OsP5CS1. (B) OsP5CS2. (C) OsP5CR. (D) OsProDH. Levels of the transcript were normalized to two internal reference genes OsAct and OsEF-1α. Expression levels of genes in salt-stressed plants were normalized with respect to those in non-stressed plants. Data represent the means ± SE (n = 9). H-hours.

