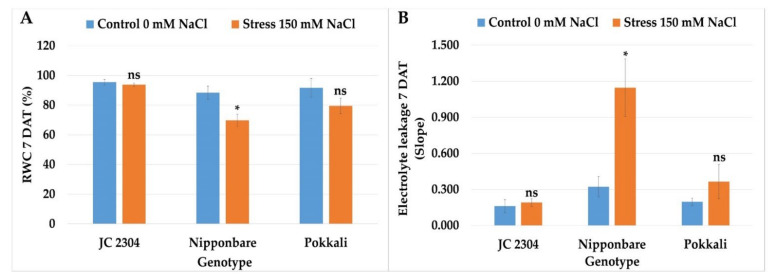
Figure 6.
Effects of 150 mM NaCl on relative water content and electrolyte leakage of wild and cultivated rice at 7 days exposure to salinity stress. (A) RWC. (B) Electrolyte leakage. Data represent the means ± SE (n = 3). Asterisks indicate the significant difference of salt-stressed plants with respect to non-stressed plants, based on the Student t-test (ns-not significant, * p ≤ 0.05). DAT—day after treatment.

