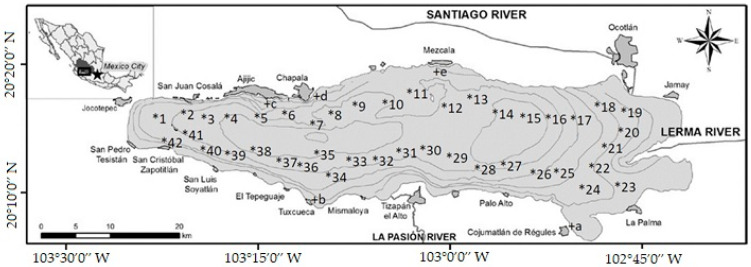
Figure 1.
Map of Lake Chapala, adapted from Membrillo-Abad, Torres-Vera et al. 2016 [16], distribution of sediment, water, and fish samples. * With numbers; indicates sampling stations for water and sediments. + With letters; indicates fish sampling stations, also corresponds to landing of local fishermen (Cojumatlan de Regules, Tuxcueca, Ajijic, Chapala, and Mezcala).

